Enterprise asset platform for McKinsey (via Capgemini)
Two and a half years on one platform.
An internal platform for managing data and compute assets across client engagements. It brought project setup, asset access and budget management into one place.
Product Designer at Capgemini, 2020–2023 — sole designer at first, later part of a design team.
The 10-second version
Each client engagement runs in its own project.
An engagement is one piece of client work, and each one gets a project: the team and their access, the assets the work runs on, and the spend against the budget. An asset is any resource the work needs — a dataset, a database, a compute environment — connected to a project and charged for the time it stays up. Assets come from a shared marketplace, and the people who supply them have a space of their own. This is the platform as it ended up — the rest of the case is how it got there.
01 — Project
A project is opened for each client engagement
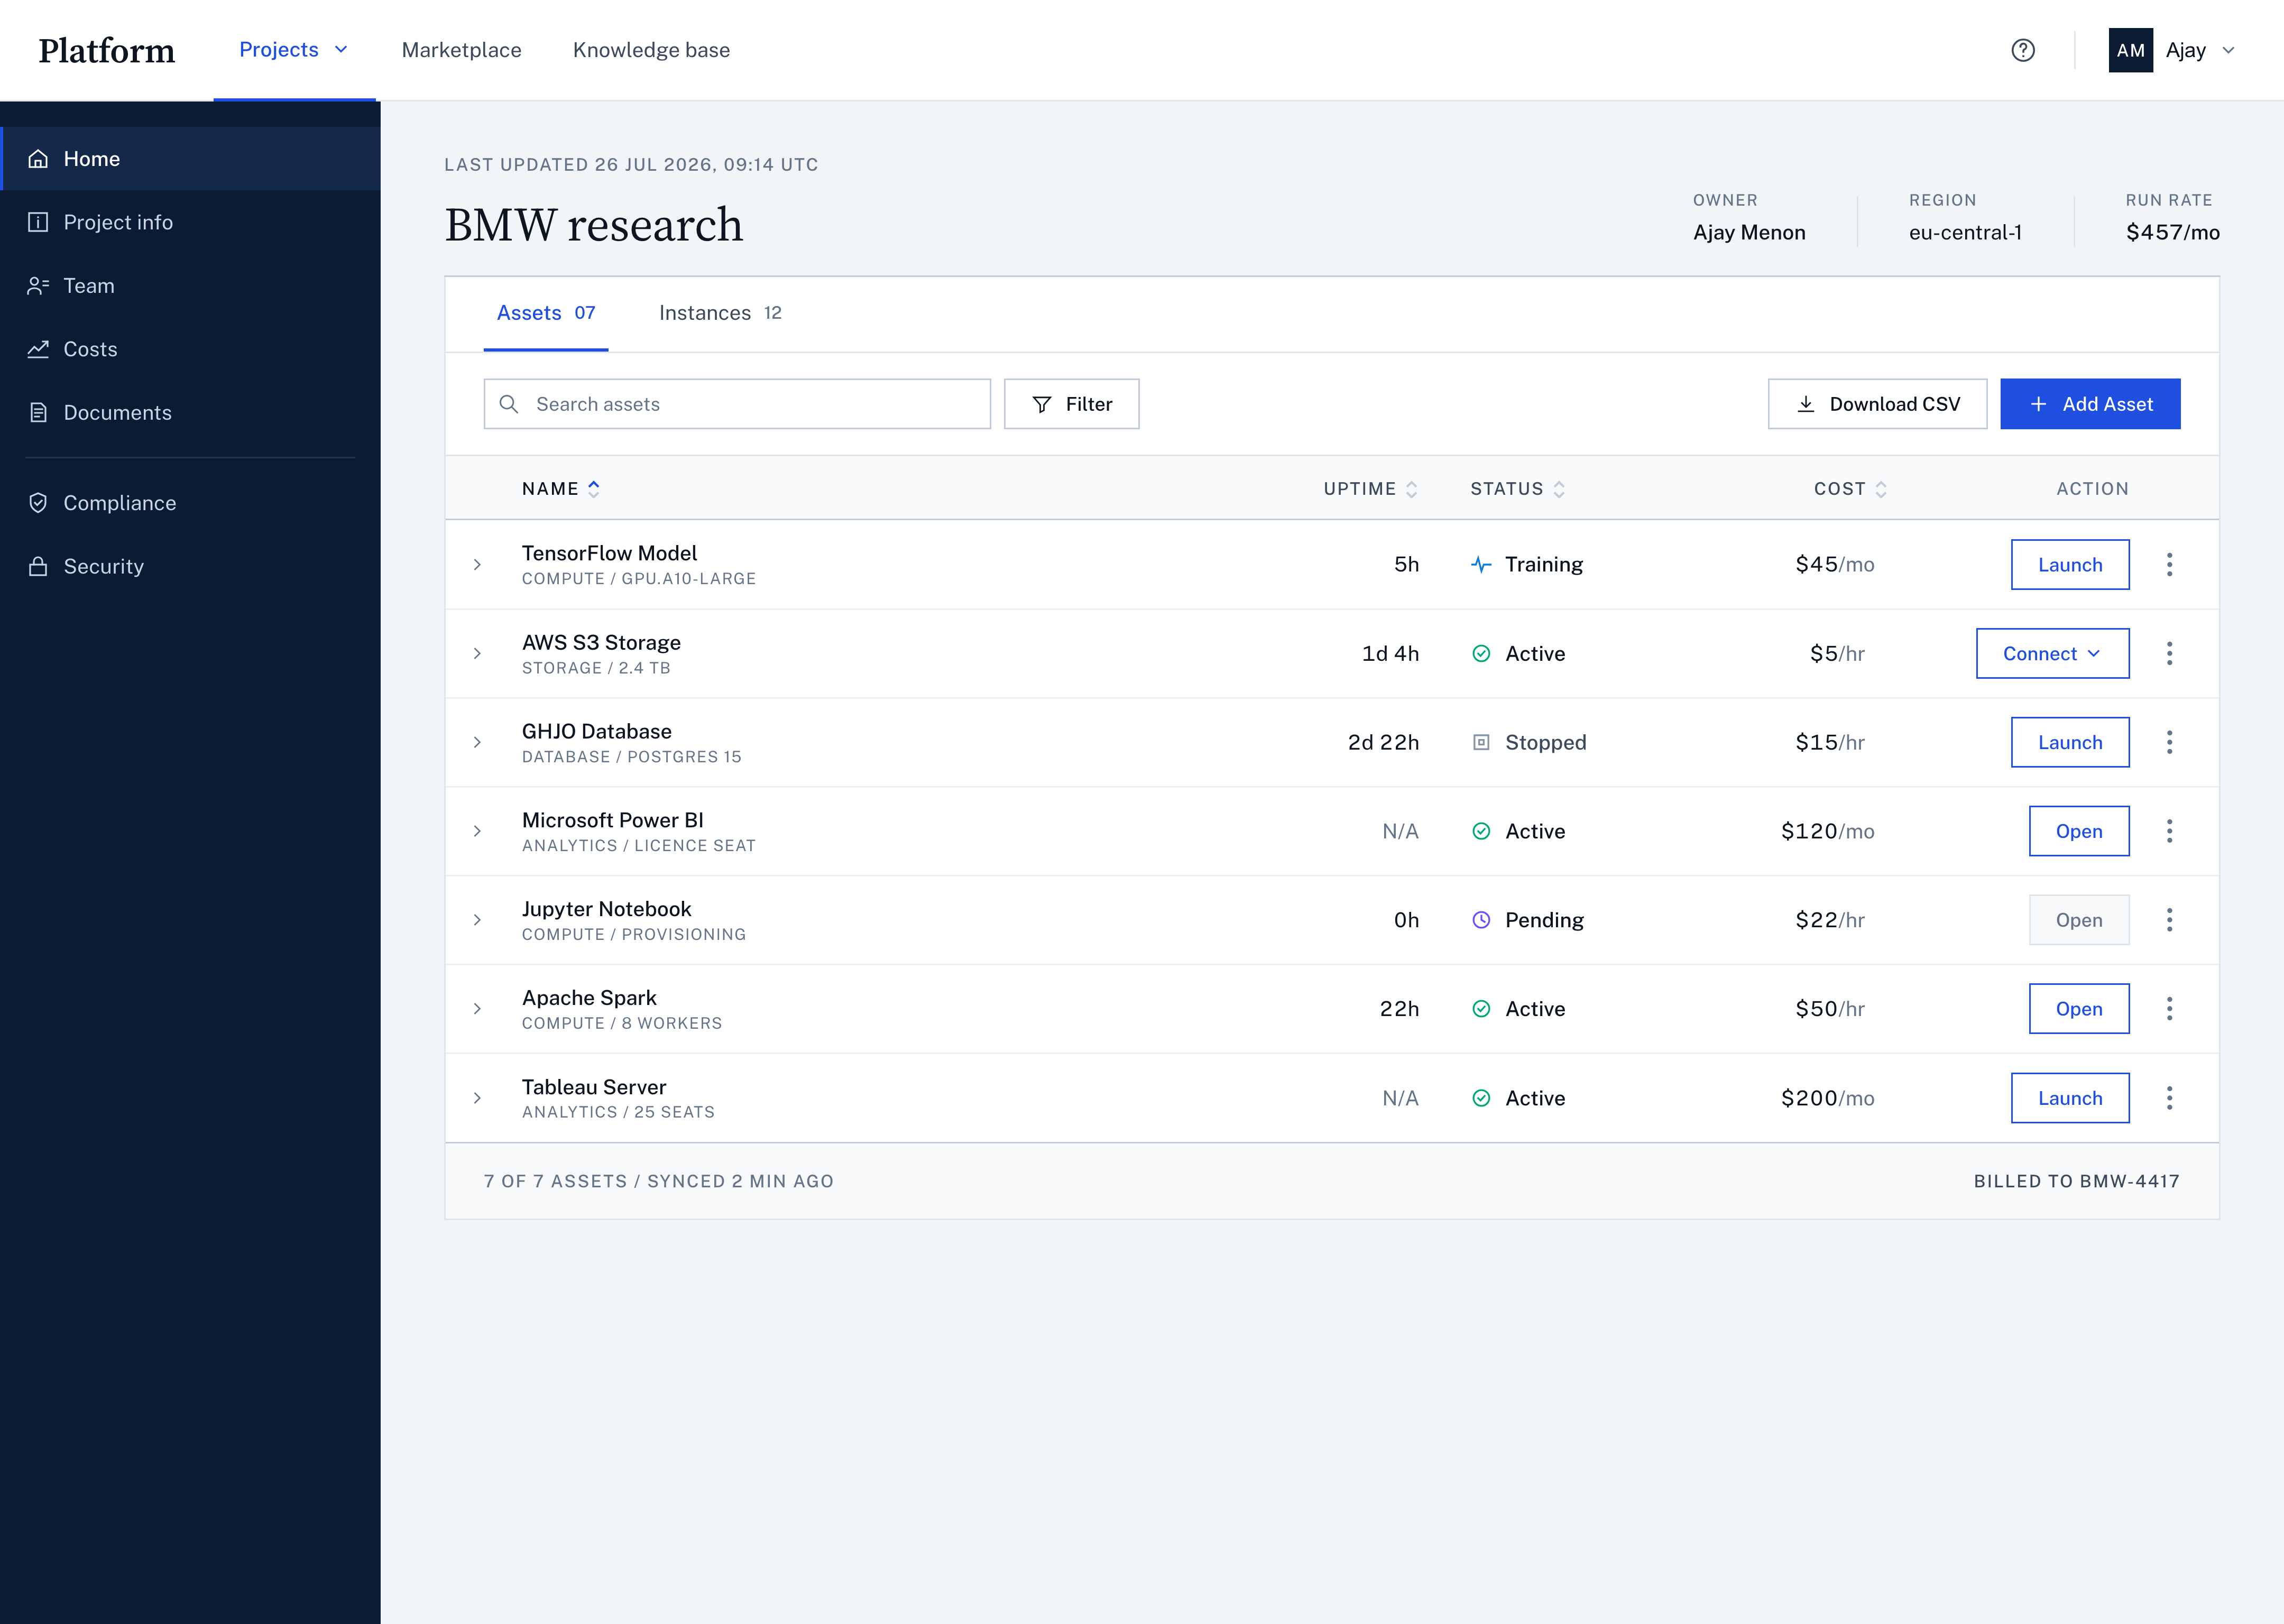
It holds the team and what each person can reach, the data and compute assets connected to the work, and the spend as it accumulates against the budget — the assets table below is one tab of it.
02 — Marketplace
A project's assets come from one shared catalog
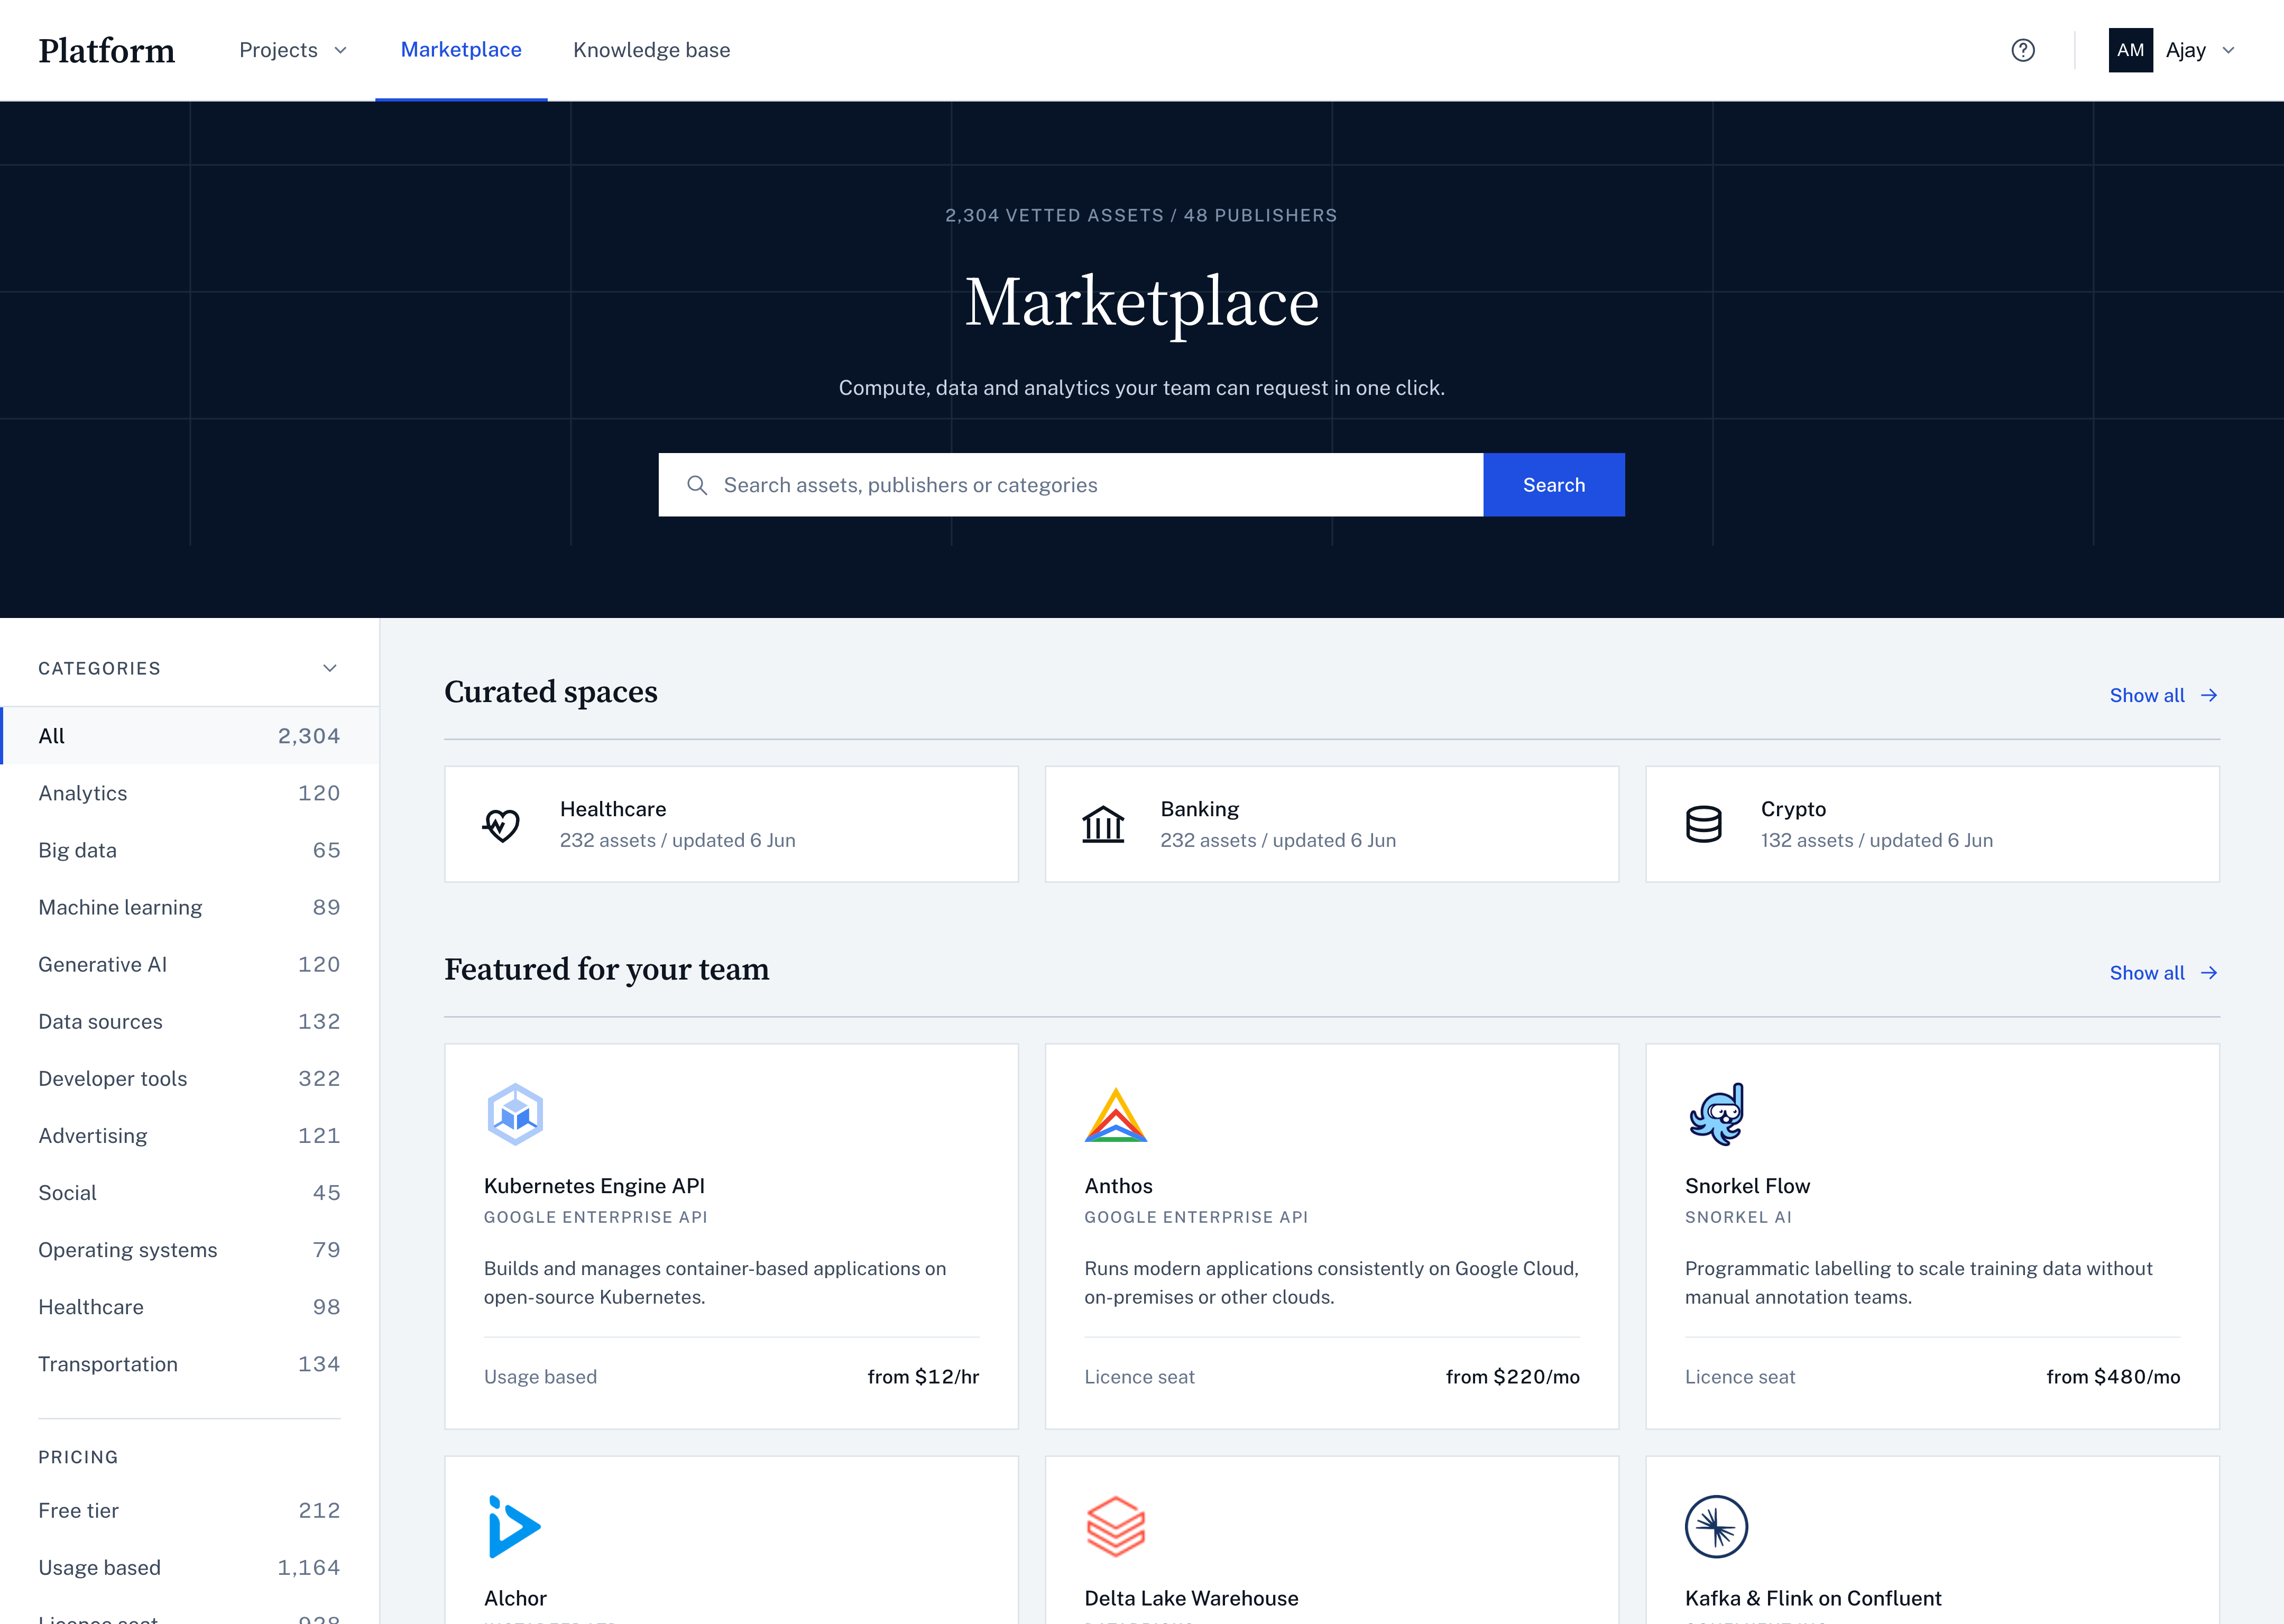
Teams come to the marketplace to find data and compute assets and connect them to their project. Industry-specific collections give a faster way in than search, and access arrives two ways: take the asset immediately, or request one that has to be assembled.
03 — Publisher space
Publishers see which projects use their assets
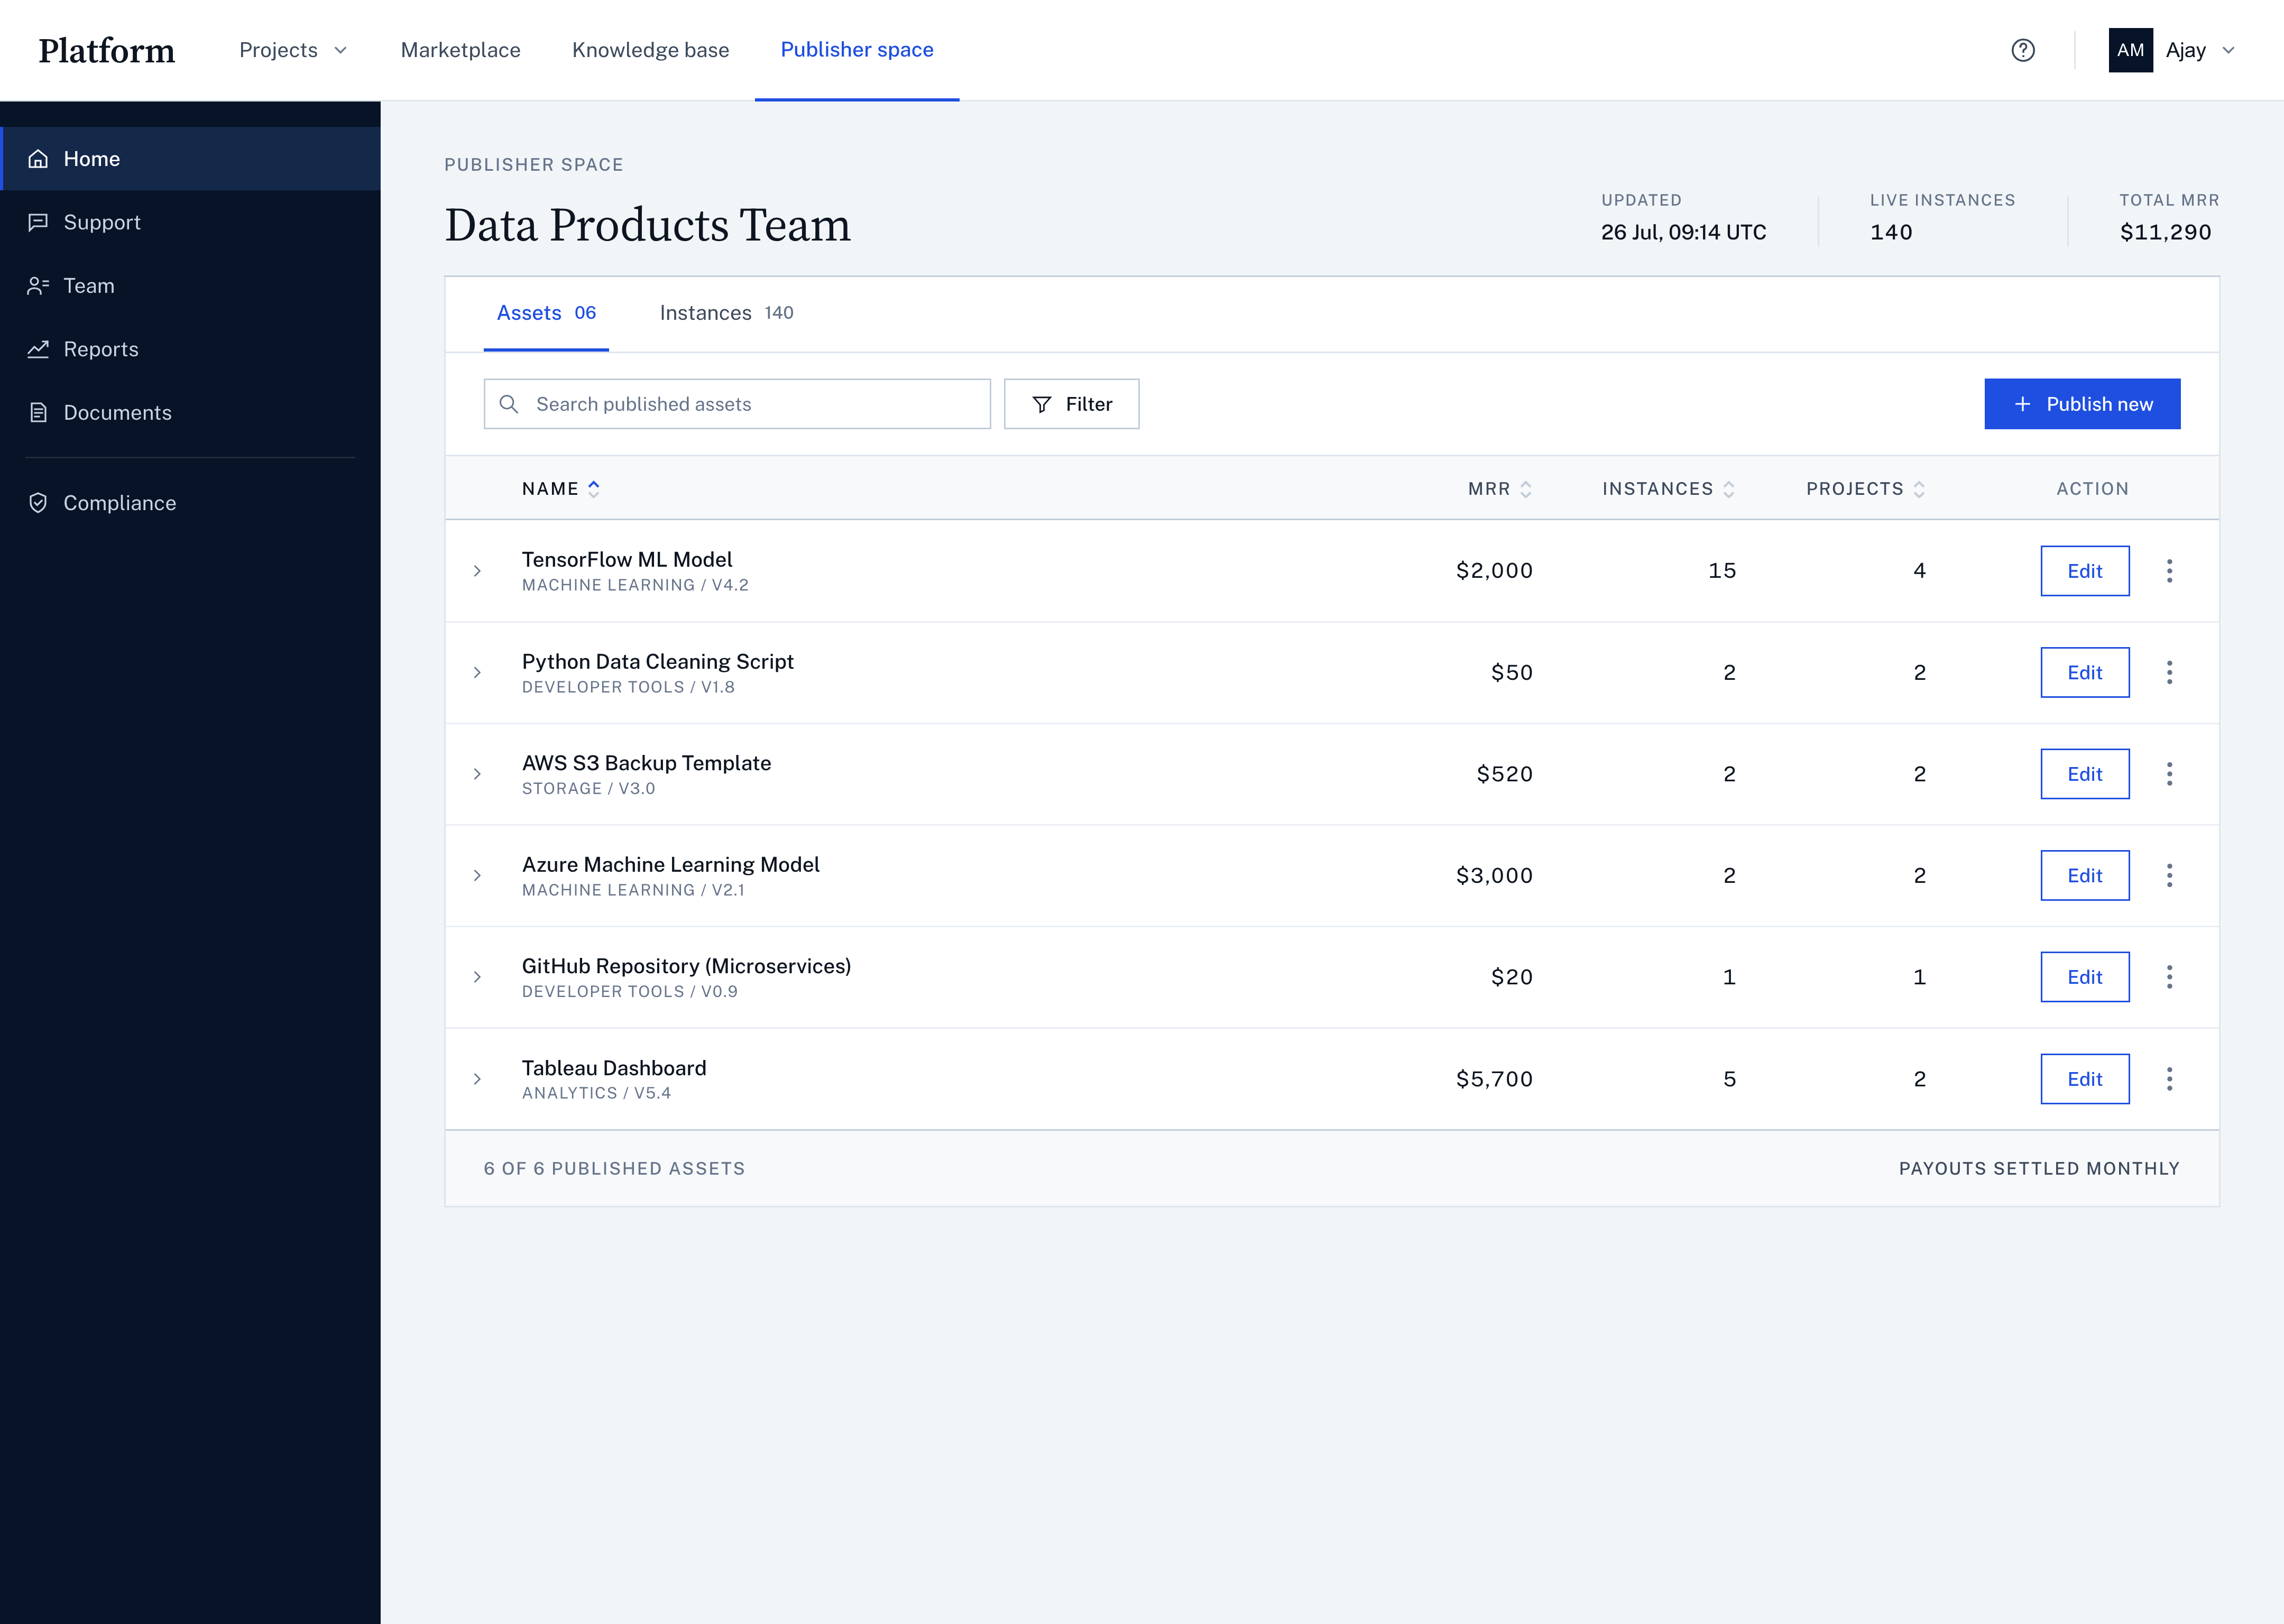
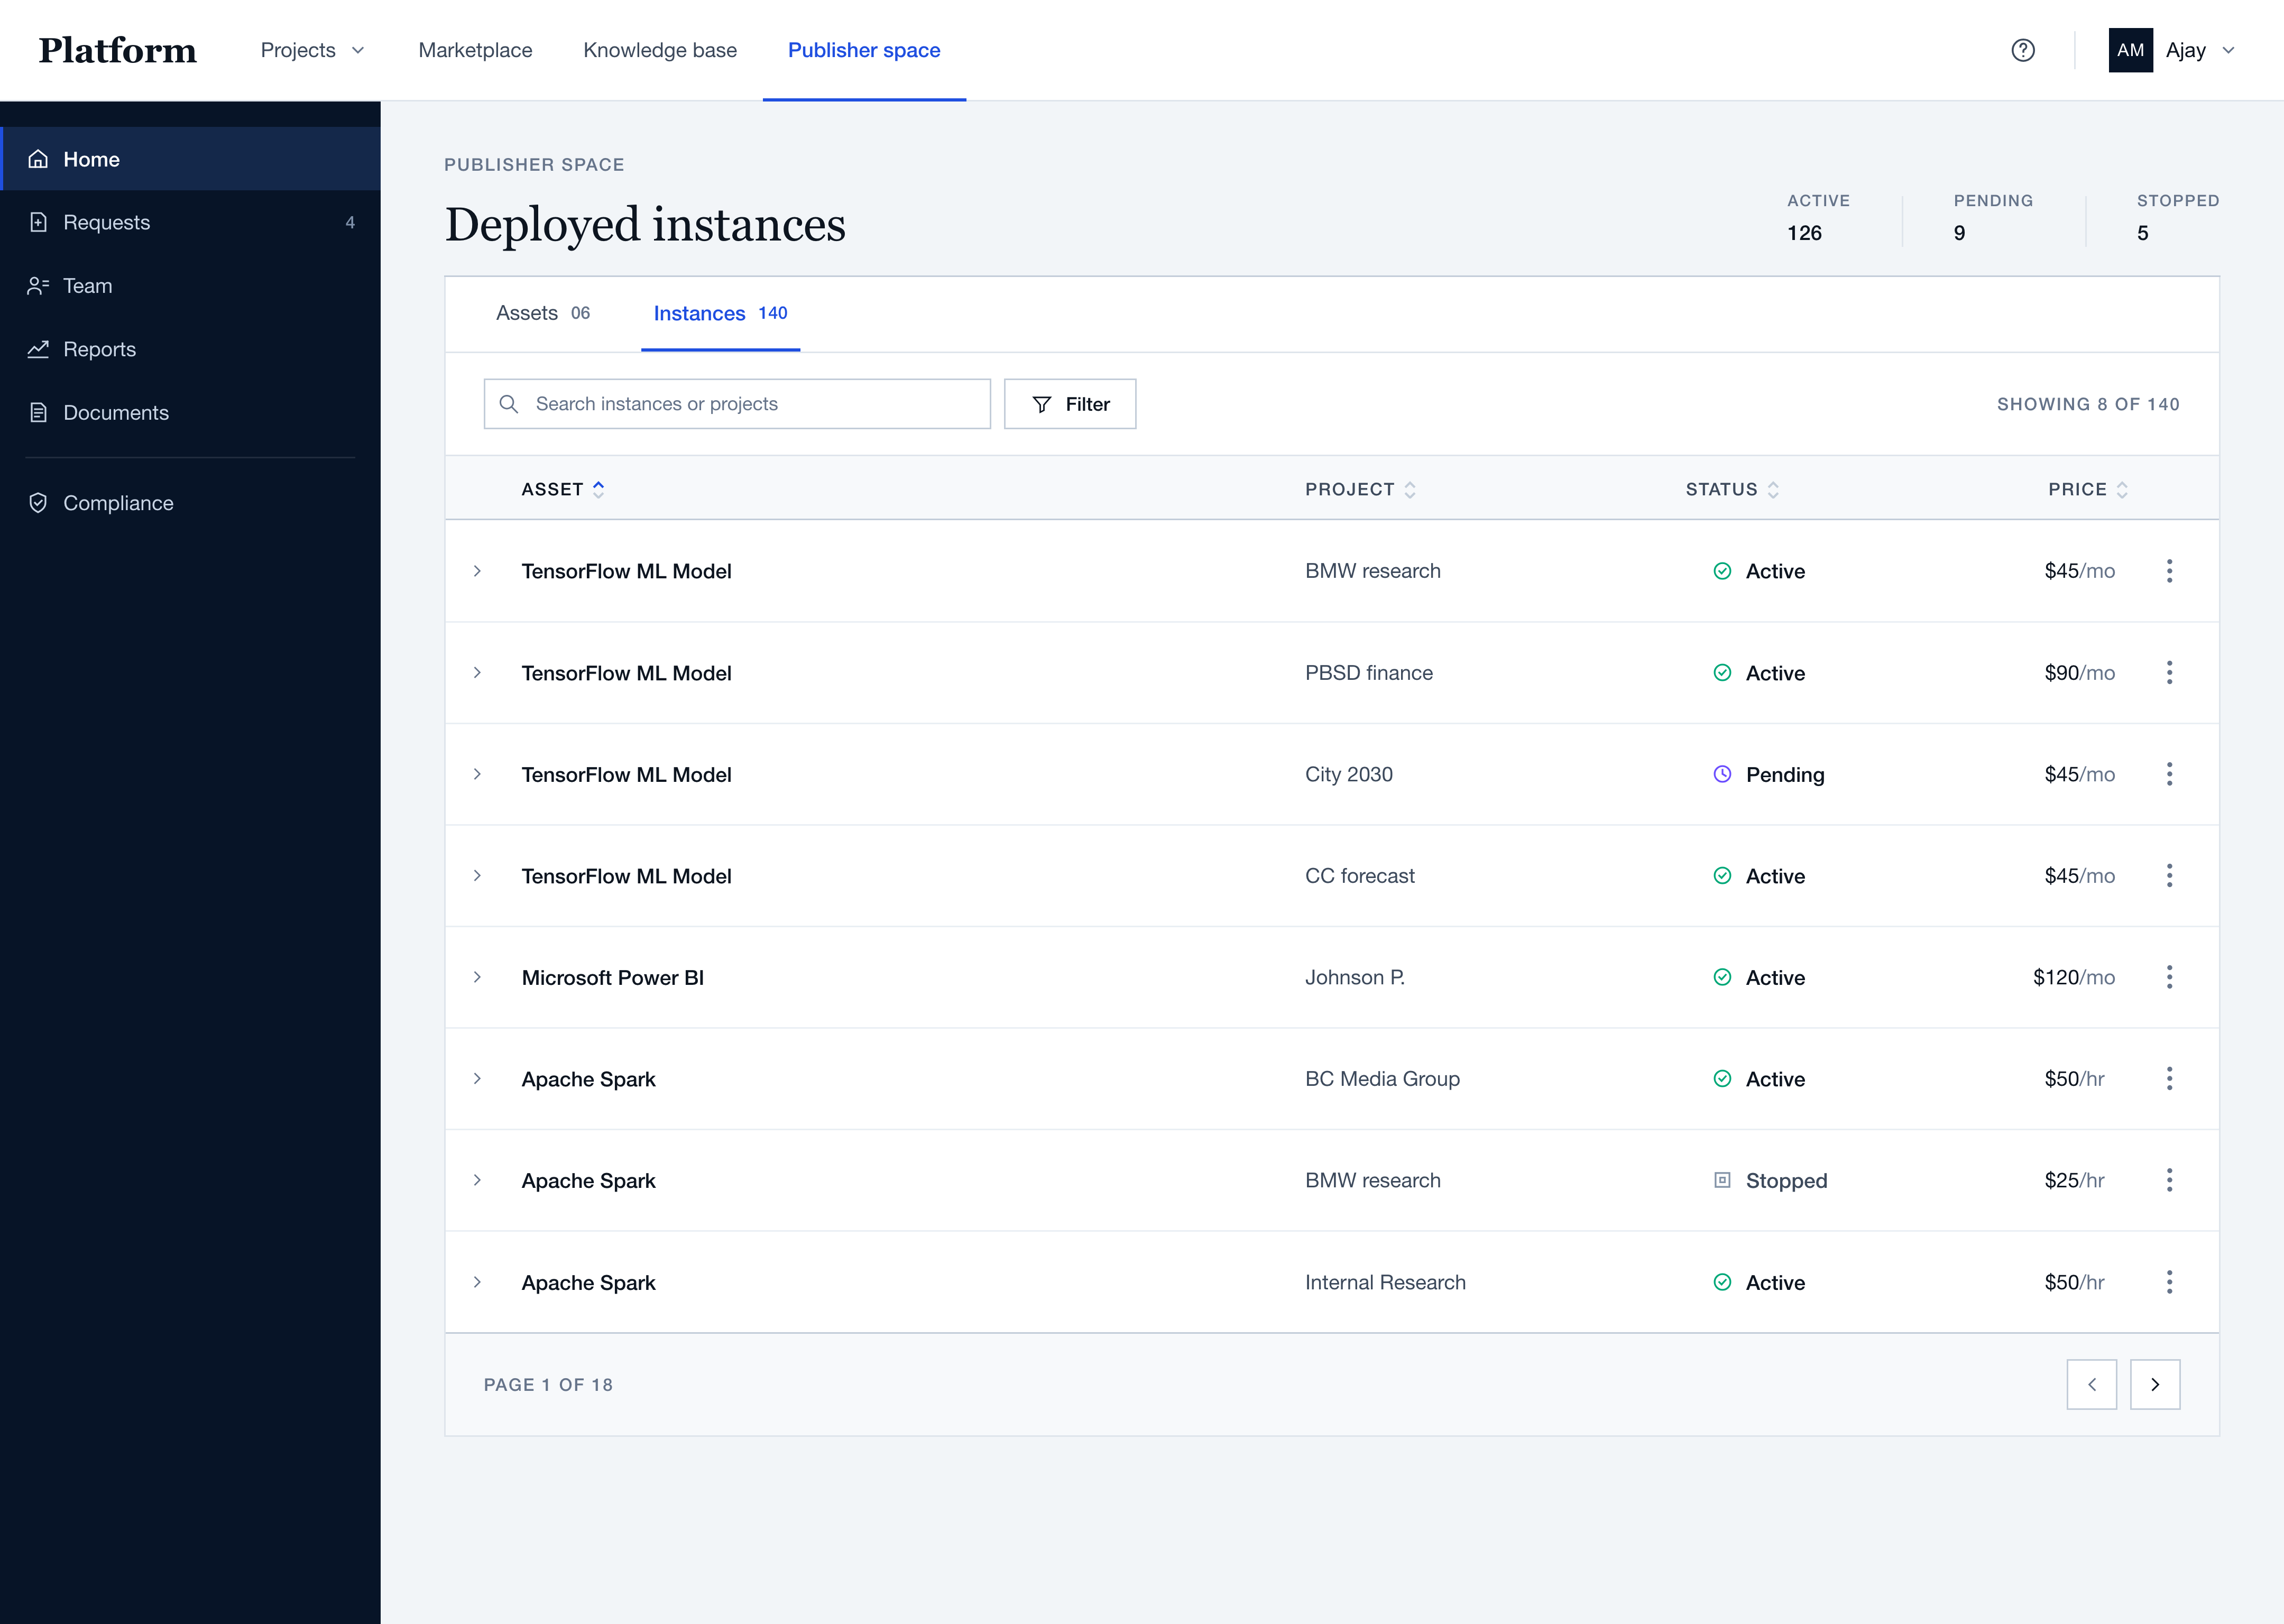
Publishers are the internal teams whose data and compute the rest of the firm works on. Their space shows which assets they support, which projects have connected them, how many instances are running in those projects and what the usage adds up to at the end of the month.
How they connect
Every asset in a project arrives the same way
A publisher makes an asset available in the shared catalog; a team finds it there and connects it to its project, where it becomes a line with a status, an owner and an hourly cost. The same asset is marked in all three windows below.
Publisher space
One row per asset it owns
Published
Marketplace
One card per asset on offer
Connected
Project
One row per asset in use
01The adoption problem
The internal launch did not move whole engagements onto the platform.
McKinsey had recently introduced an acquired product as an internal platform for data and compute assets. Adoption remained low. The platform covered part of the work, while teams still managed assets, access and budgets through separate tools and processes. We needed to find what prevented an engagement from moving onto the platform end to end.
We compared each role's path with and without the platform.
Together with the product manager, I shaped the research strategy around one goal: identify what stopped each role from moving an engagement onto the platform. I proposed stakeholder interviews, helped moderate a week-long cross-functional workshop, and conducted user interviews and testing sessions.
For each role, we started with their work and responsibilities. We then reconstructed the same scenario in the platform or through the process they used instead, and noted where the path broke. I synthesized these findings into role-based personas and customer journey maps, making the blockers and unmet needs visible for each role. Their effect on an entire engagement determined the roadmap order.
Across the project, the team completed 40 user interviews and 24 moderated testing sessions. Because this was an internal product, we could recruit working users regularly and continue interviews and testing throughout the project.
Four roles, four different blockers.
Each role encountered a different part of the problem. We prioritized the blockers that prevented an entire engagement from moving onto the platform.
Role
What they needed to complete the work
Where it broke
Roadmap position
Engagement leads and directors
Engagement-wide impact
What they needed to complete the work
Budget and cost transparency across the engagement; a way to give the client access to results.
Where it broke
Budgets lived in separate tools outside the platform, and project composition did not match the engagement hierarchy.
Roadmap position
First release
Create a project, connect assets, see the budget.
Analysts
Daily use
What they needed to complete the work
Find an asset and connect it to the project without leaving the work.
Where it broke
Manual requests had no visible status. Teams also struggled to understand what the catalog contained and whether its descriptions were reliable.
Roadmap position
First release
Separate self-service assets from requests that required manual work.
Data engineers
Technical side
What they needed to complete the work
Configuration and uptime of a connection: the technical half of getting an asset into a project.
Where it broke
Connection settings and access rules were split between the project and the asset, with no single place to manage them.
Roadmap position
Later
Added later, when permissions were redesigned at both project and asset level.
Asset publishers
Outside the platform
What they needed to complete the work
A place of their own to publish an asset and see what happened to it afterwards.
Where it broke
Publishers had no interface for adding assets themselves. They sent a request, and the platform team added the asset to the marketplace manually.
Roadmap position
Deferred
Publisher space returned in year two, when the catalog migration brought publishers into the platform.
Why this order
Publisher tools were deferred because assets could still reach the catalog through the existing manual process. The blockers preventing an entire engagement from using the platform came first.
The product's model did not match the firm's.
The acquired product had been designed for a different market. Three parts of its underlying model had to change: project roles, asset access and the place of policy management.
Project roles were rebuilt around the engagement hierarchy. The product arrived with one flat member list. Composition was rebuilt to follow a real engagement, giving leads, directors and team members the appropriate access and budget visibility.
Self-service assets and manually assembled assets became separate flows. One path had served both a dataset a team could take itself and a request that needed a person to fulfil it. Once they were separate, requests that required manual work could show their status.
Policy management was removed from the project model. It came from the product's own market and had no owner or clear use inside an engagement.
The first release focused on running an engagement end to end.
We prioritized the path that allowed an engagement lead to create a project, connect the required assets and manage the budget in one place. Other improvements remained in the roadmap.
Publisher tools were deferred. Assets could still enter the marketplace through the existing manual process, while missing project roles and financial management prevented whole teams from adopting the platform. Publisher space returned to the roadmap in year two, when the catalog migration brought publishers into the platform.
02Year by year
How the platform expanded over two and a half years.
Over those years, the platform took on more of the work surrounding an engagement: the asset catalog, publisher workflows, budgets, forecasts and permissions.
Year1
Year 1
The existing asset catalog moved into the platform
The firm kept its asset catalog outside the platform, with no access management: getting an asset meant asking a person. Moving it in meant rebuilding it for the volume — thousands of items instead of the marketplace's few dozen — with categories to navigate them and access managed inside the platform.
Marketplace — the category sidebar.
Year 1
Asset requests moved into the marketplace
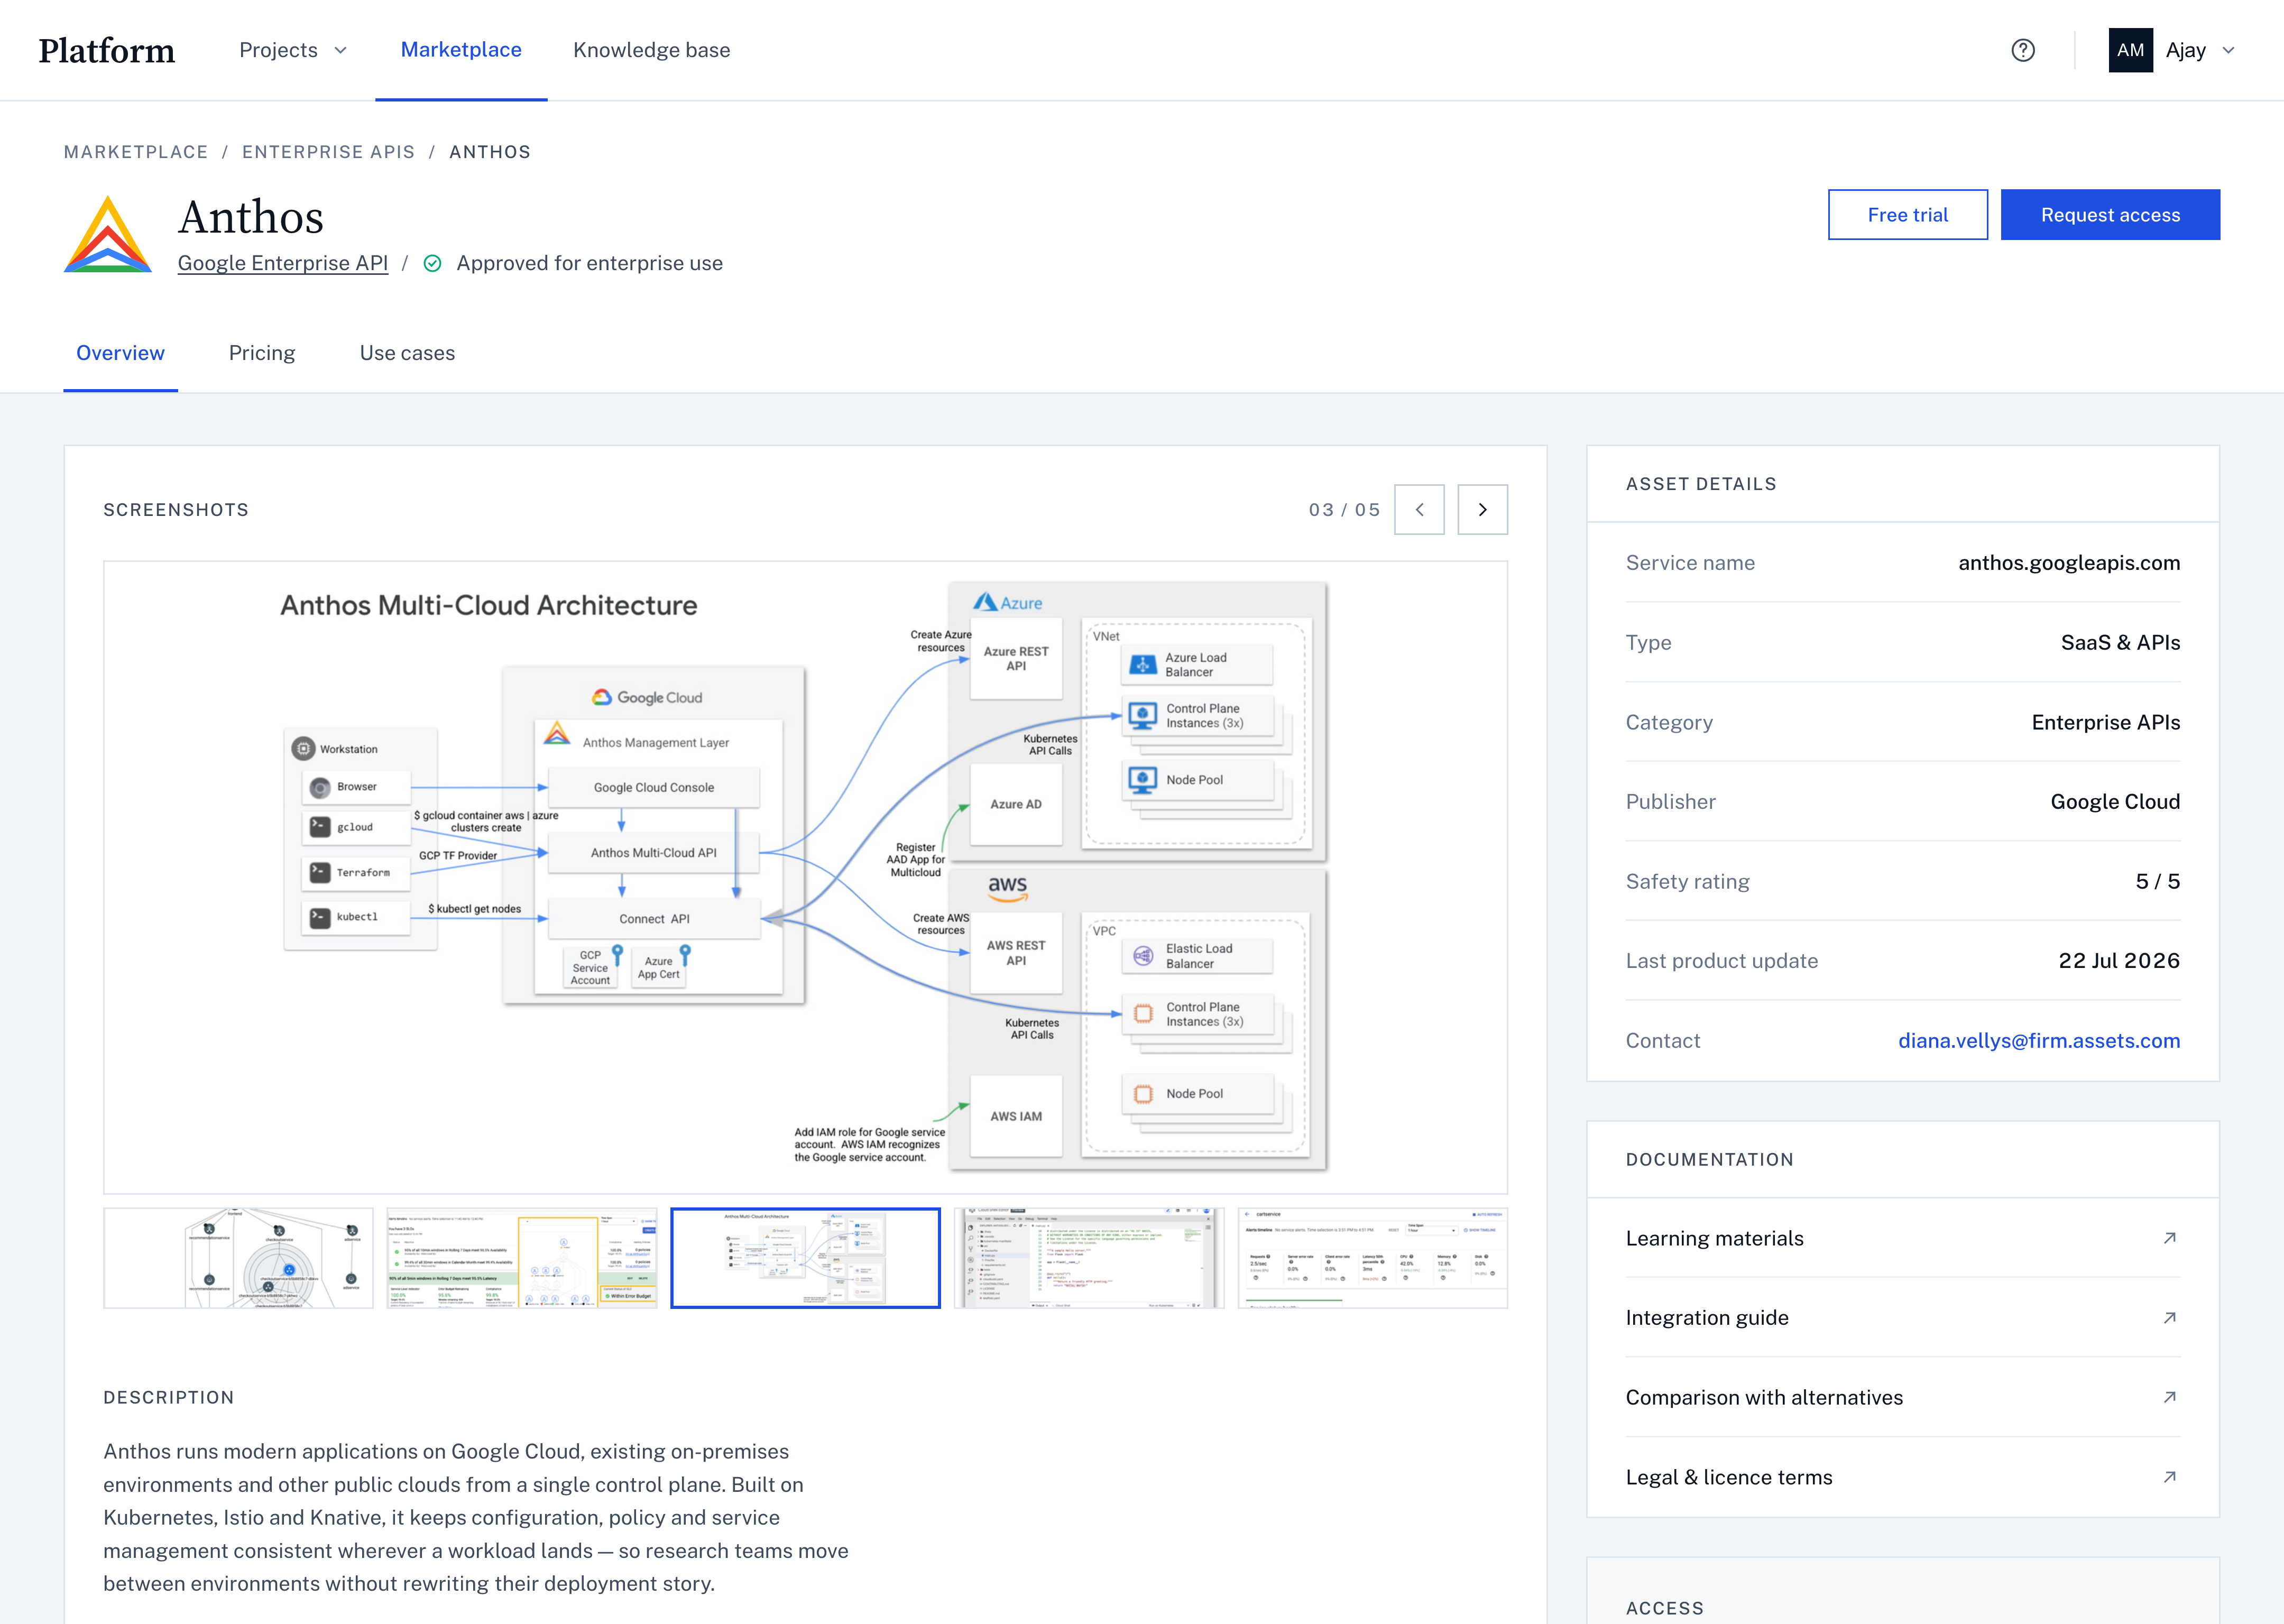
The asset page brought together what a team needed in order to decide and to ask: the publisher, the safety rating, when the asset last changed, who to contact — and the request itself, started from the page.
Asset page — the details panel.
Year 1
The platform moved to McKinsey's new design system
All of that landed on a surface being rebuilt underneath it. The migration ran while people kept working in the platform, and the target system was still incomplete. I used it to fix accessibility at the same time: type moved off grey, sizes went up, and colour coding gained a second, non-colour marker.
A project page after the migration.
Year 2
Catalog migration created the need for publisher tools
Moving the catalog in brought the asset owners onto the platform — the condition under which the deferred publisher space was to be reconsidered. Publishers now needed to see where their assets were running, and for whom.
Publisher space — one asset across several projects.
Year 2
The knowledge base explained how assets and projects worked
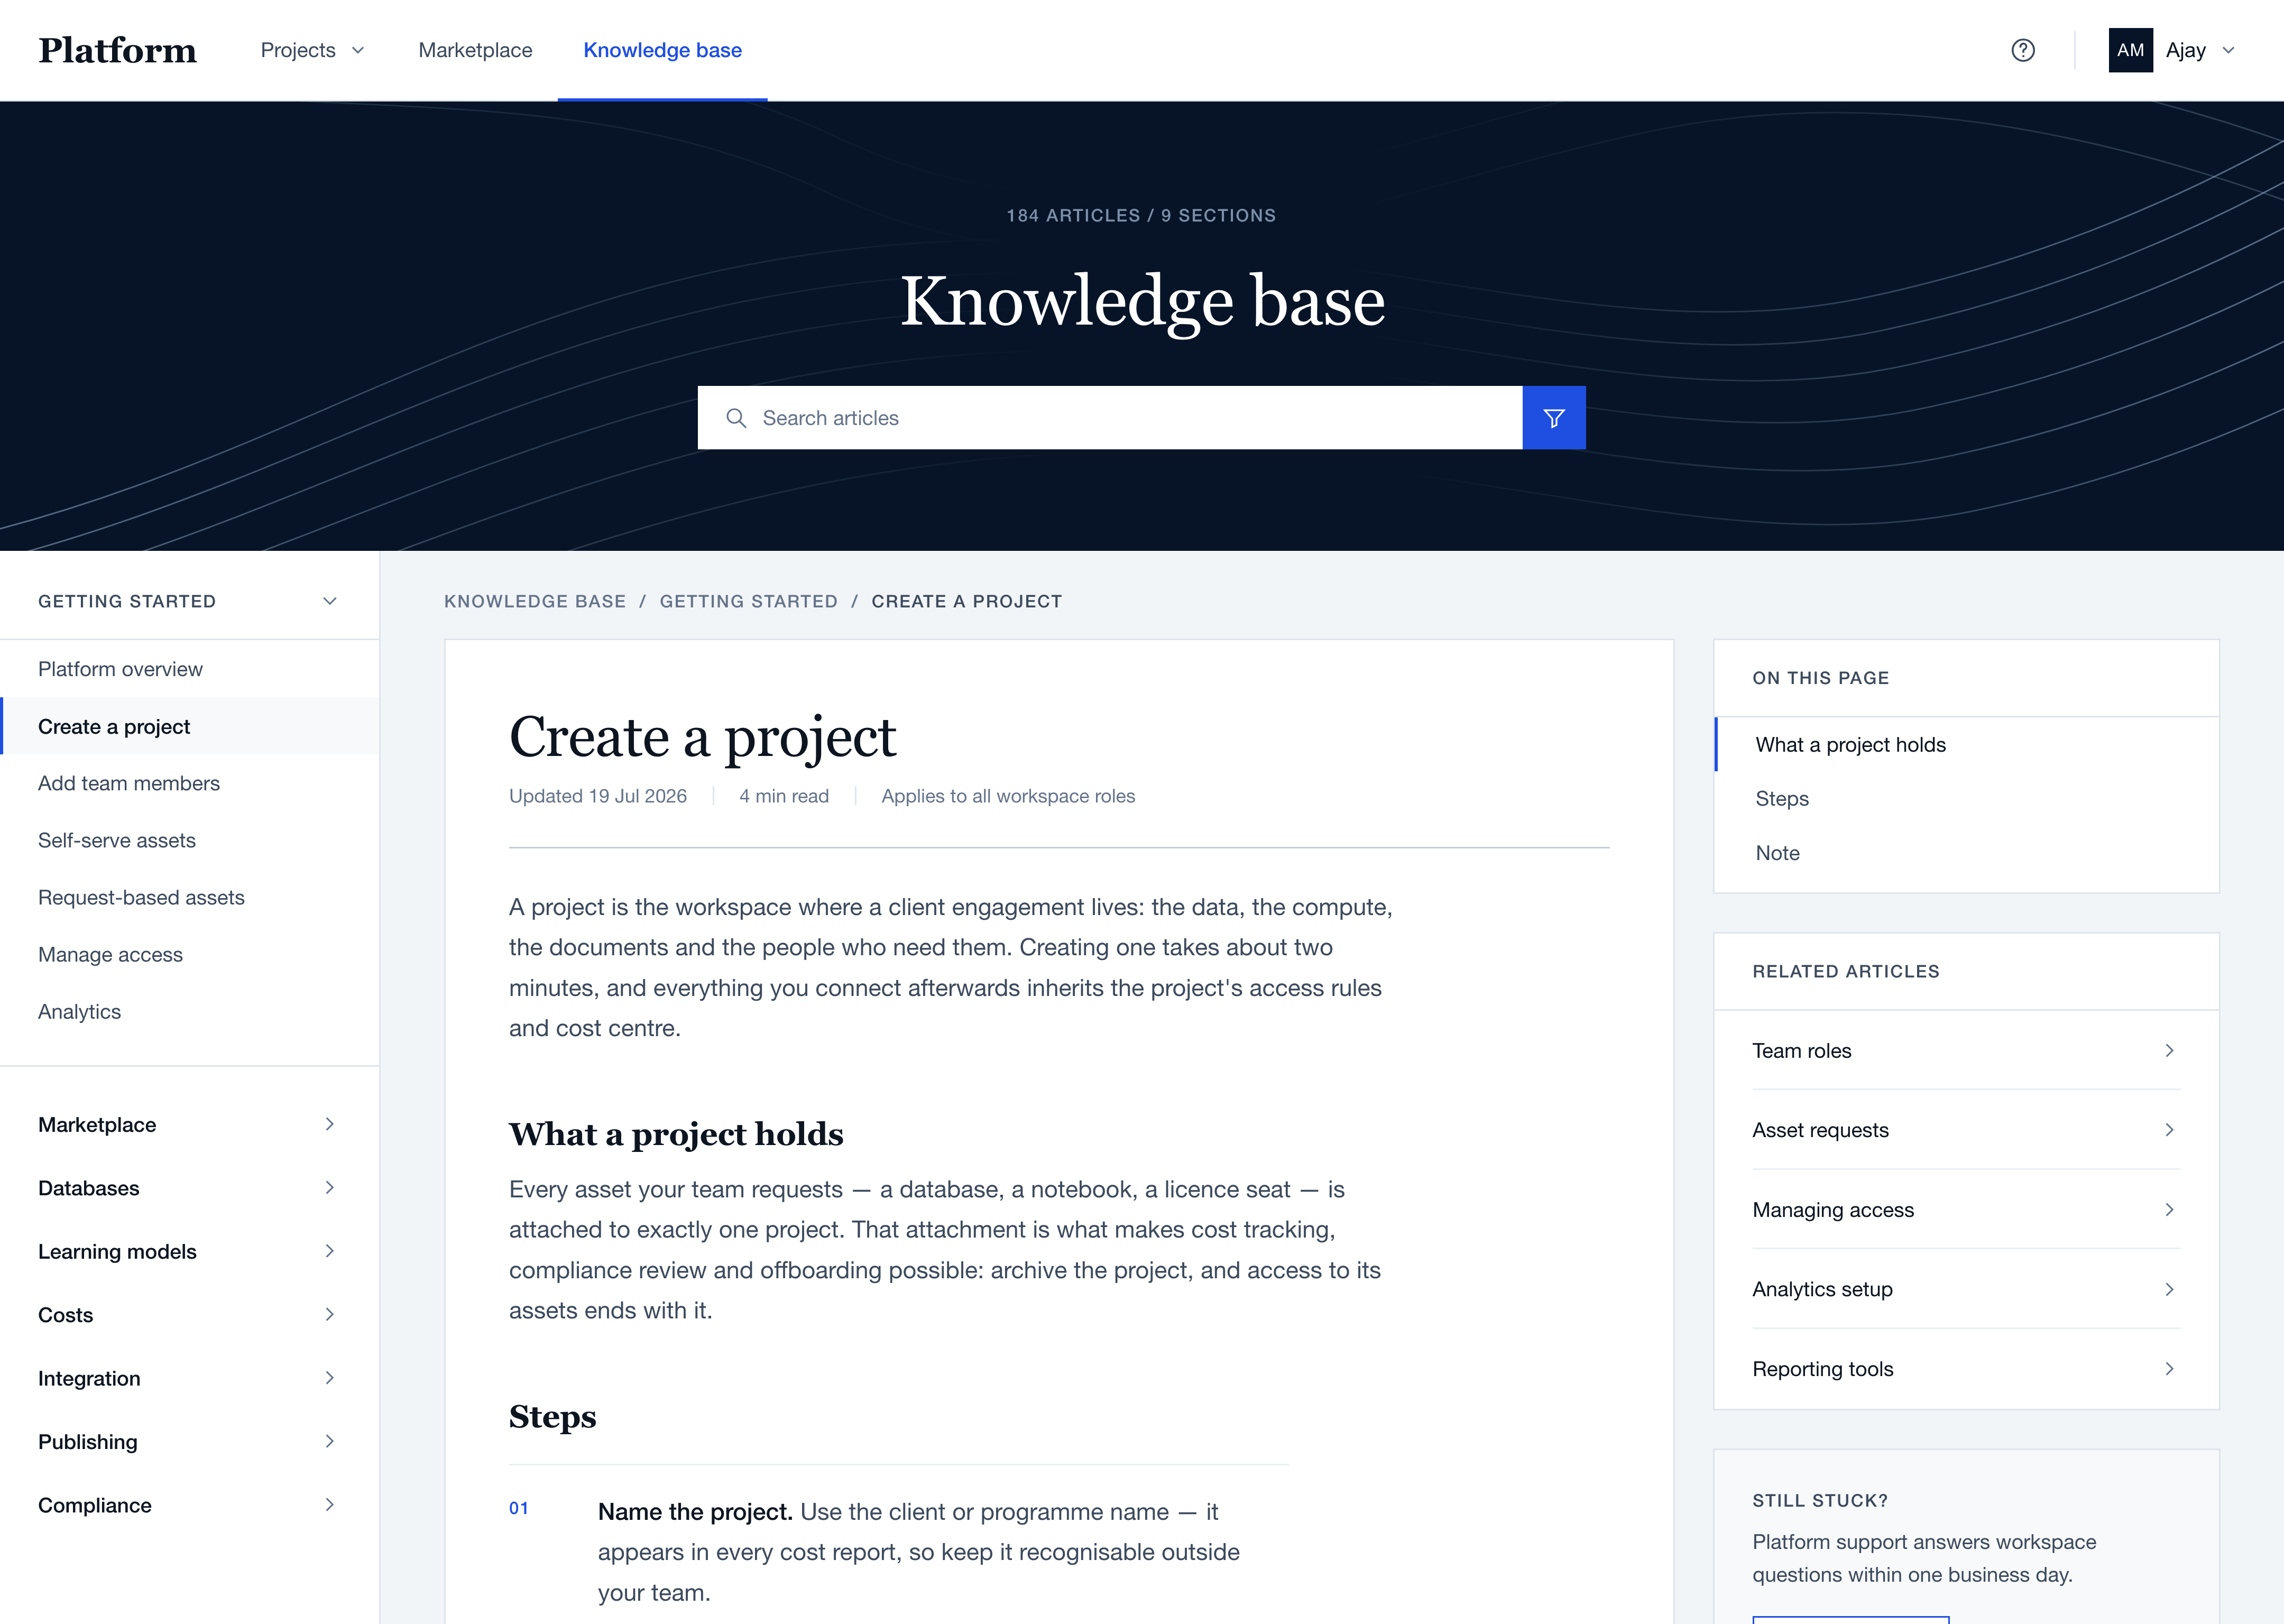
One finding from the first research was still open: teams did not trust what asset descriptions said. The catalog was reworked, and a knowledge base was built beside it — what a project holds, what an asset attaches to, what happens when it is archived.
The knowledge base.
Year 3
Teams could compare current spend with forecast cost
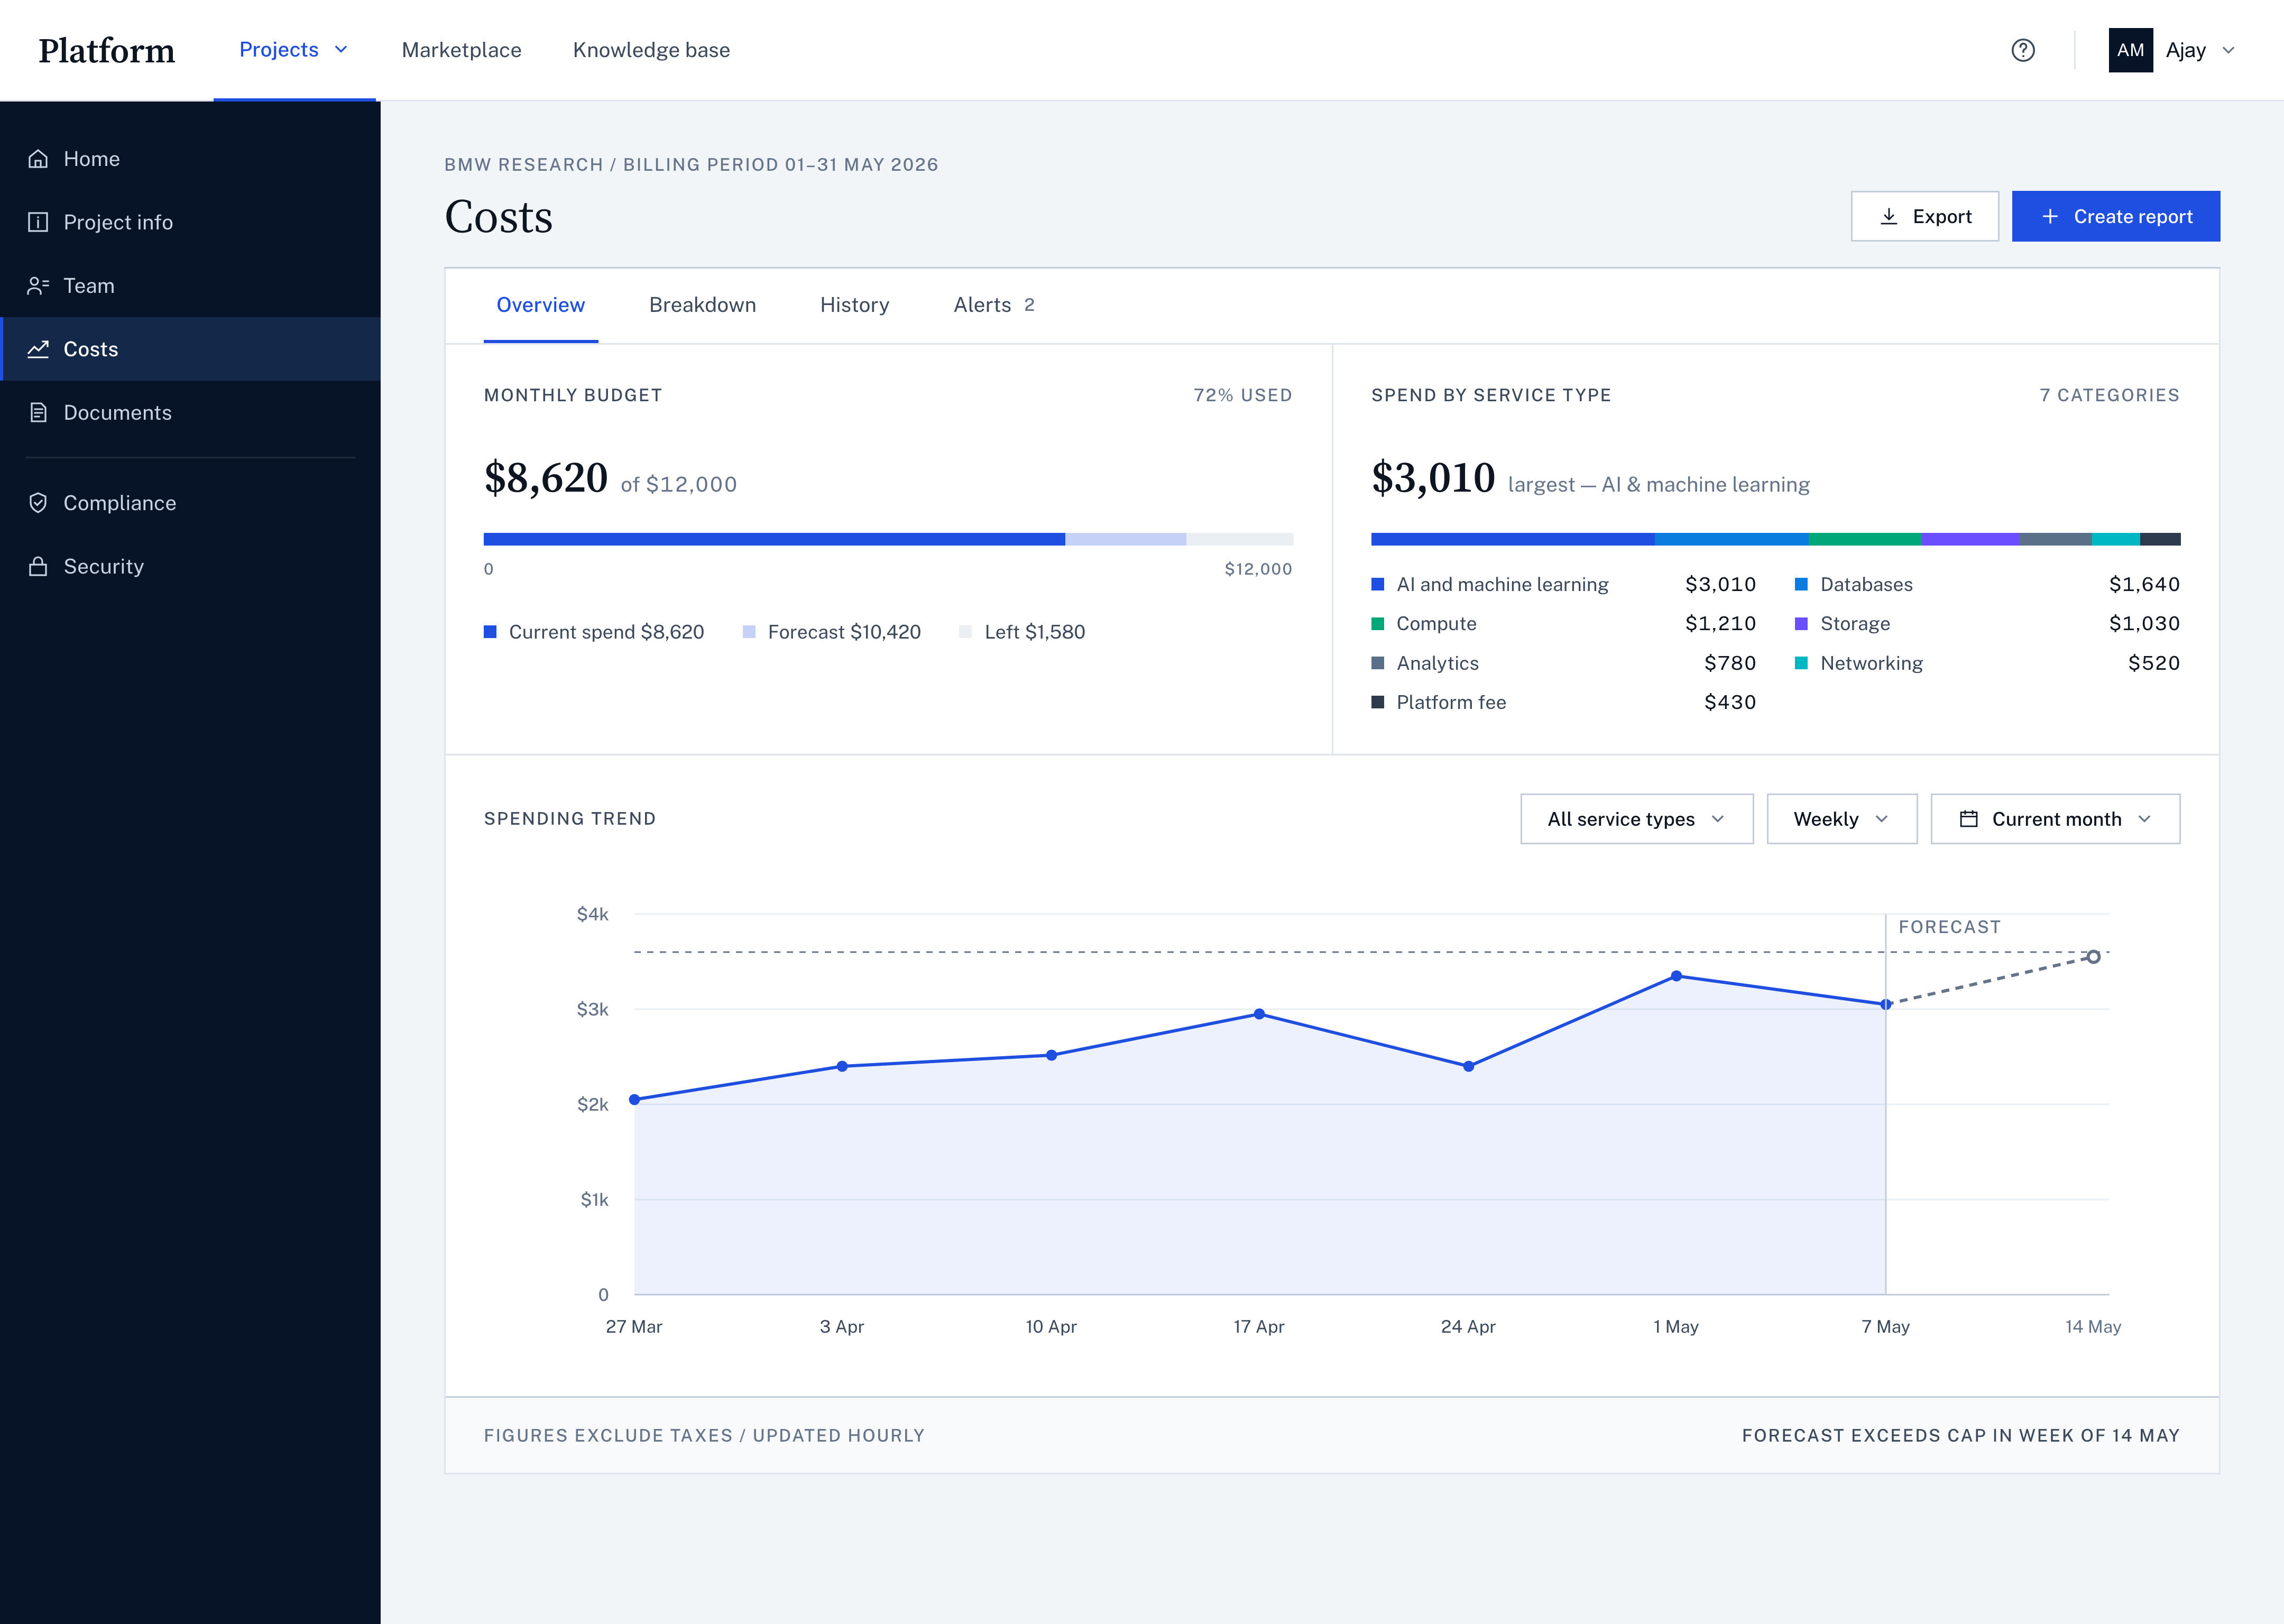
Spend inside the platform answered what an engagement had already used. The forecast answered what it was heading towards: cost broken out by service type, a trend, and the line the spend extends to.
Costs — where the forecast takes over.
Year 3
Permissions were rebuilt at project and asset level
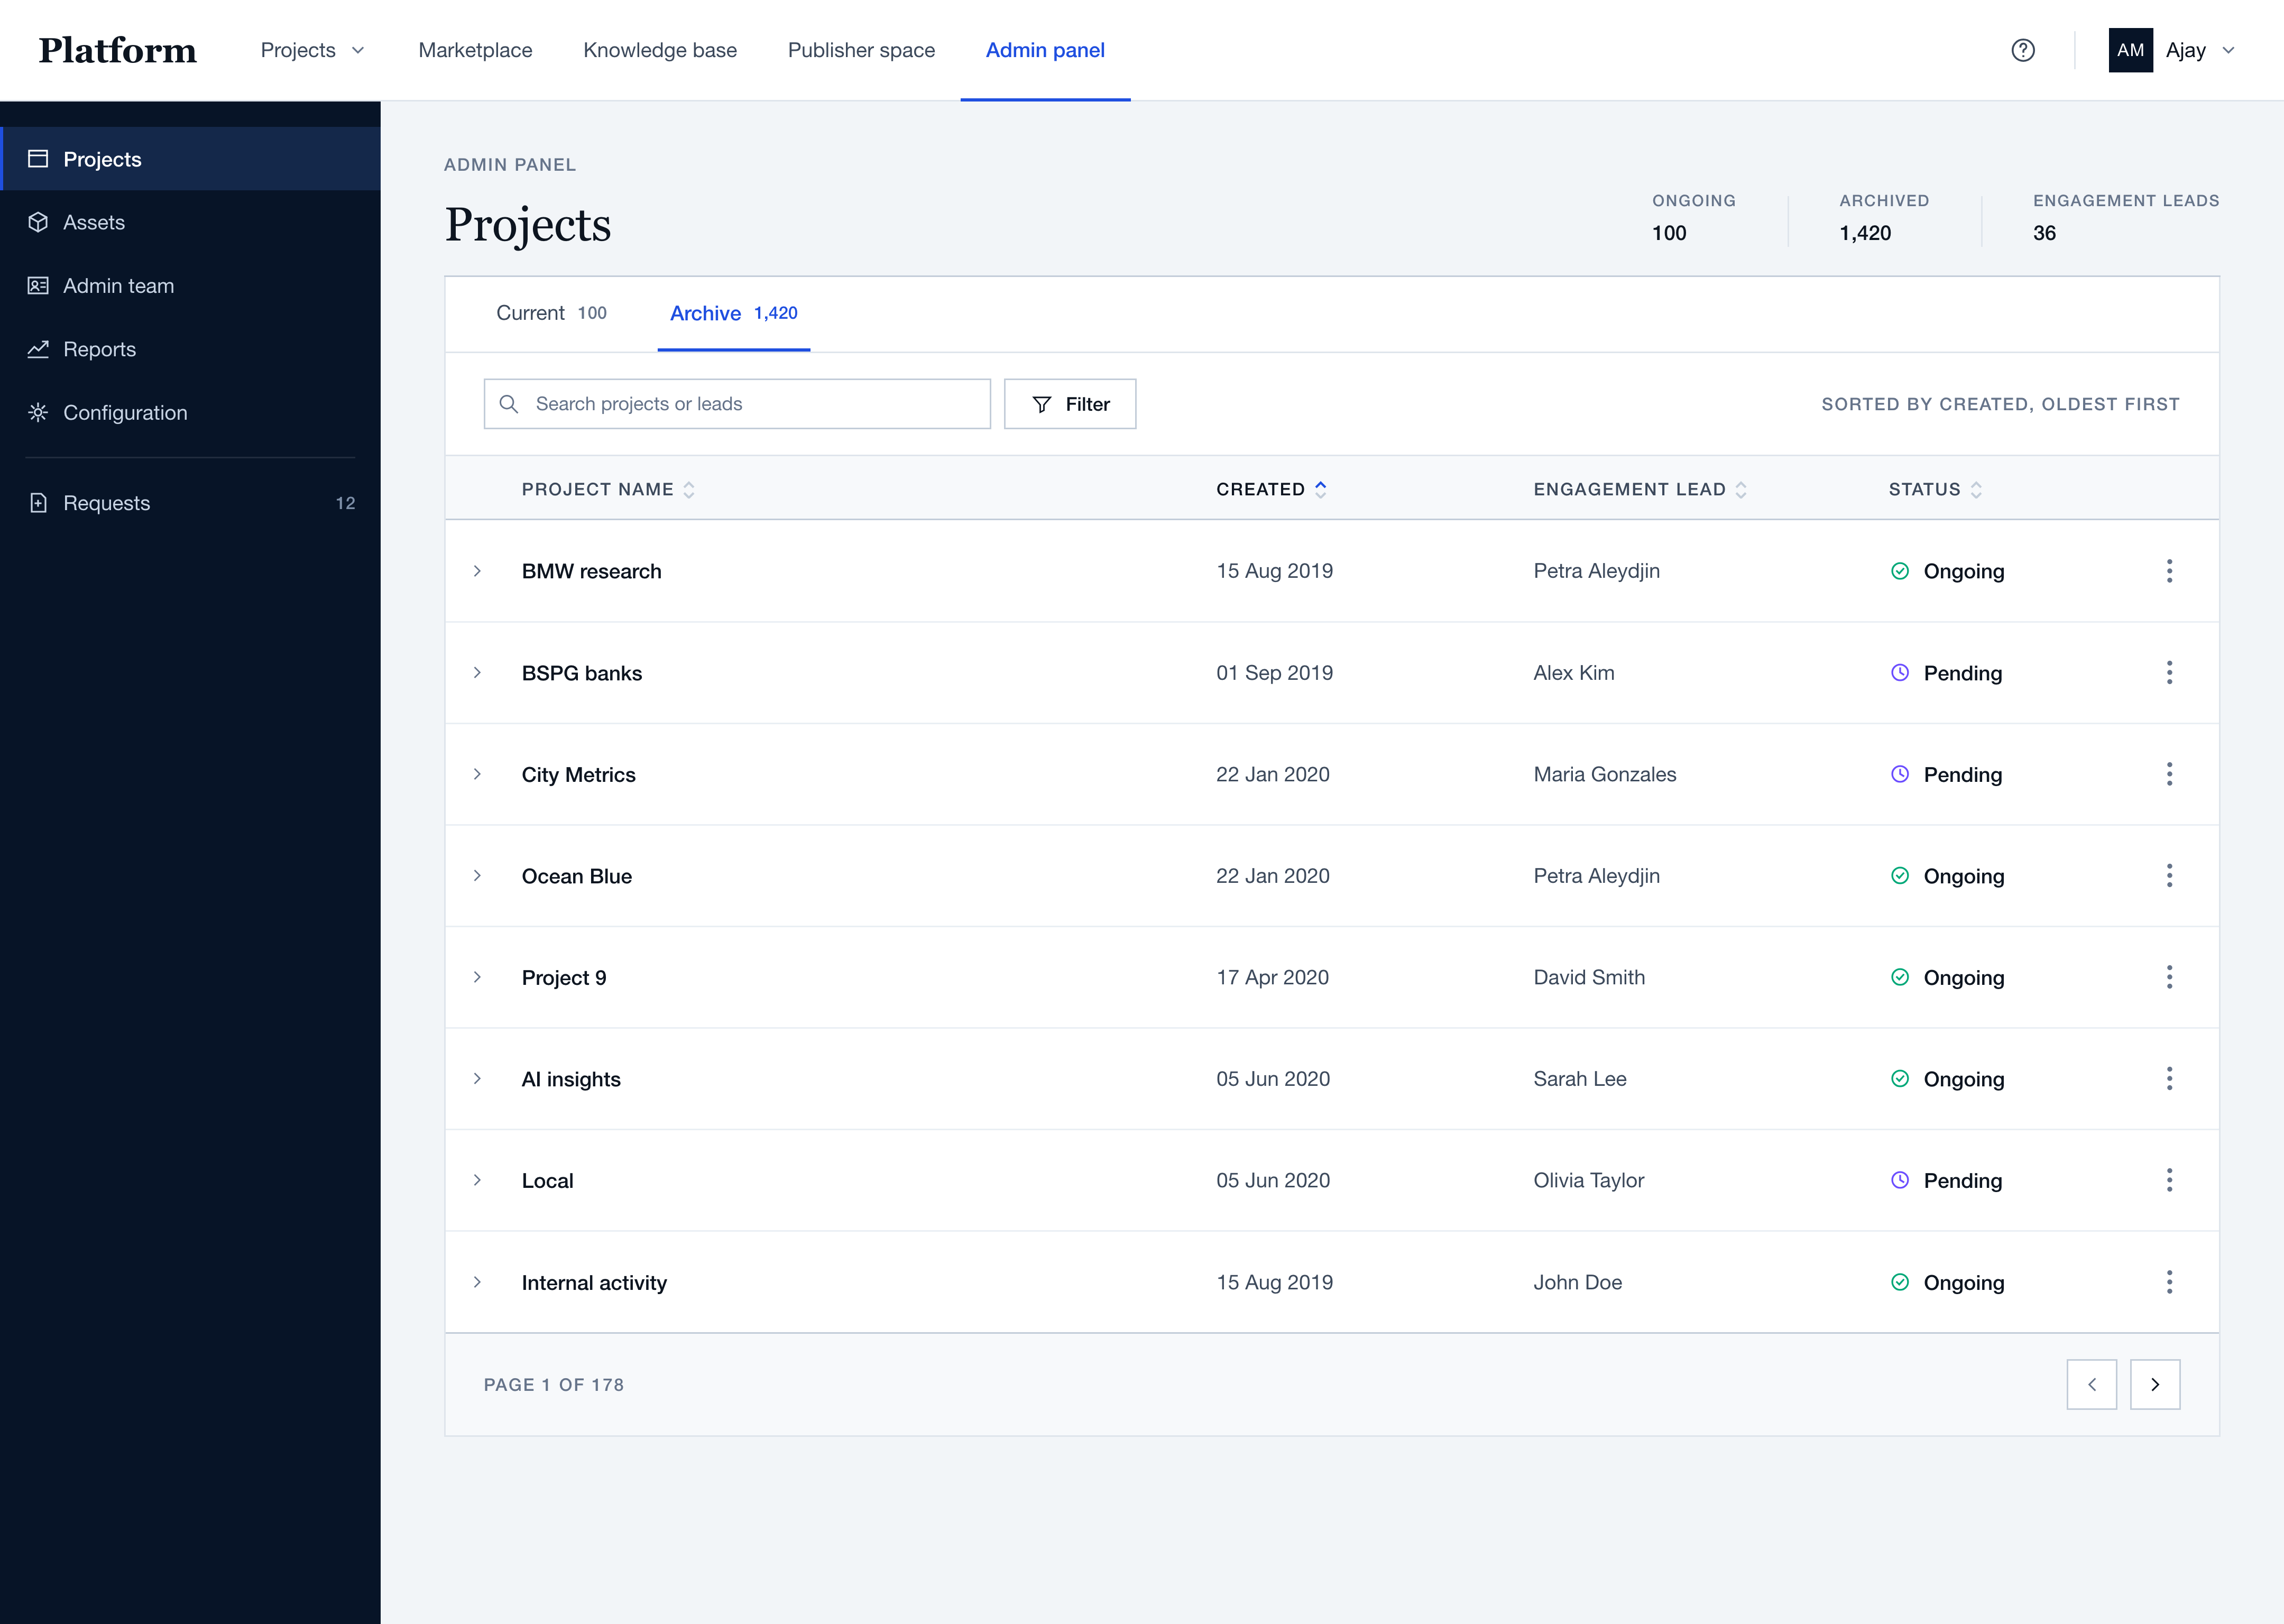
Access was two separate questions: who is on the project, and who may use the asset. Both were rebuilt, with requests for custom roles at each level, and the admin view showed the result across every engagement the firm was running.
Admin — projects across the firm.
03The hard parts
Three constraints that shaped the work
The design-system migration. The platform remained in daily use throughout the migration, while the target design system was still incomplete. We had to replace components without interrupting existing work and resolve product cases the new system did not yet cover.
The domain model. Project roles, asset access and financial operations were tightly connected. A small interface decision could require a substantial change to permissions, data relationships or backend behavior.
Permissions on two levels. The platform had to manage project membership and asset access separately, including custom roles at both levels. The interaction had to explain the distinction without making routine access requests harder.
I joined an acquired product that supported only part of an engagement's work. Over those years, the team expanded it into a platform covering project setup, asset discovery, publisher workflows, budgets and permissions.
My contribution was to keep research connected to product decisions: identify where each role's work broke, turn those findings into product changes, and test the changes with the people using them. Adoption was tracked throughout the project, and the agreed targets were met. The figures remain under NDA.
Screens recreated from the shipped product for portfolio use; sample data shown is illustrative.